Article
Multi-Touch Attribution (MTA) — Who takes credit for the sale?
There have never been more advertising channels than there are today. Social media, TV, email, search ads, direct hits and traditional print, to name a few, all contribute when it comes to product sales. But when the sales finally happen, how do we accurately decide which channel actually drove conversion? And why do we care?

Traditional Methods
Before turning to statistical models, it’s worth revisiting the traditional rule-based approaches that marketers often rely on.
Last-touch Attribution — A straight forward and common solution, attributing the conversion to the last advertising channel the customer interacted with. This is usually an over simplification of the customer journey, and undervalues earlier touch-points.
Linear Attribution — “Lets split the credit across all channels”. While diplomatic, this is a far from accurate view of the customer journey.
The Data-Driven Approach
The reality is that customer journeys are complex and unique, and simpler solutions are often misleading. Using a data driven approach, we can identify high value actions in the journey and optimize marketing spend. Markov Chain Attribution Models are a statistical method that can do exactly this.
By modeling journeys as a series of steps, we can simulate how removing each marketing channel, one by one, would impact the customer journey. If conversions drop significantly without a channel, it clearly had incremental value. This “removal effect” gives each channel credit based on its contribution, not just its position in the sequence.
Multi-Touch Attribution — A Case Study
For this case study, a random, synthetic e-commerce dataset was created, containing 5,000 customers interacting with five marketing channels:
Each time a customer interacted with a marketing channel, the time of the interaction was recorded. Time stamps are a crucial component of attribution modeling, allowing us to chronologically analyze the customer journey.
Attribution Modeling
Now that we have the dataset, let’s explore three different approaches to attribution modeling, beginning with the traditional approaches.
Traditional Methods
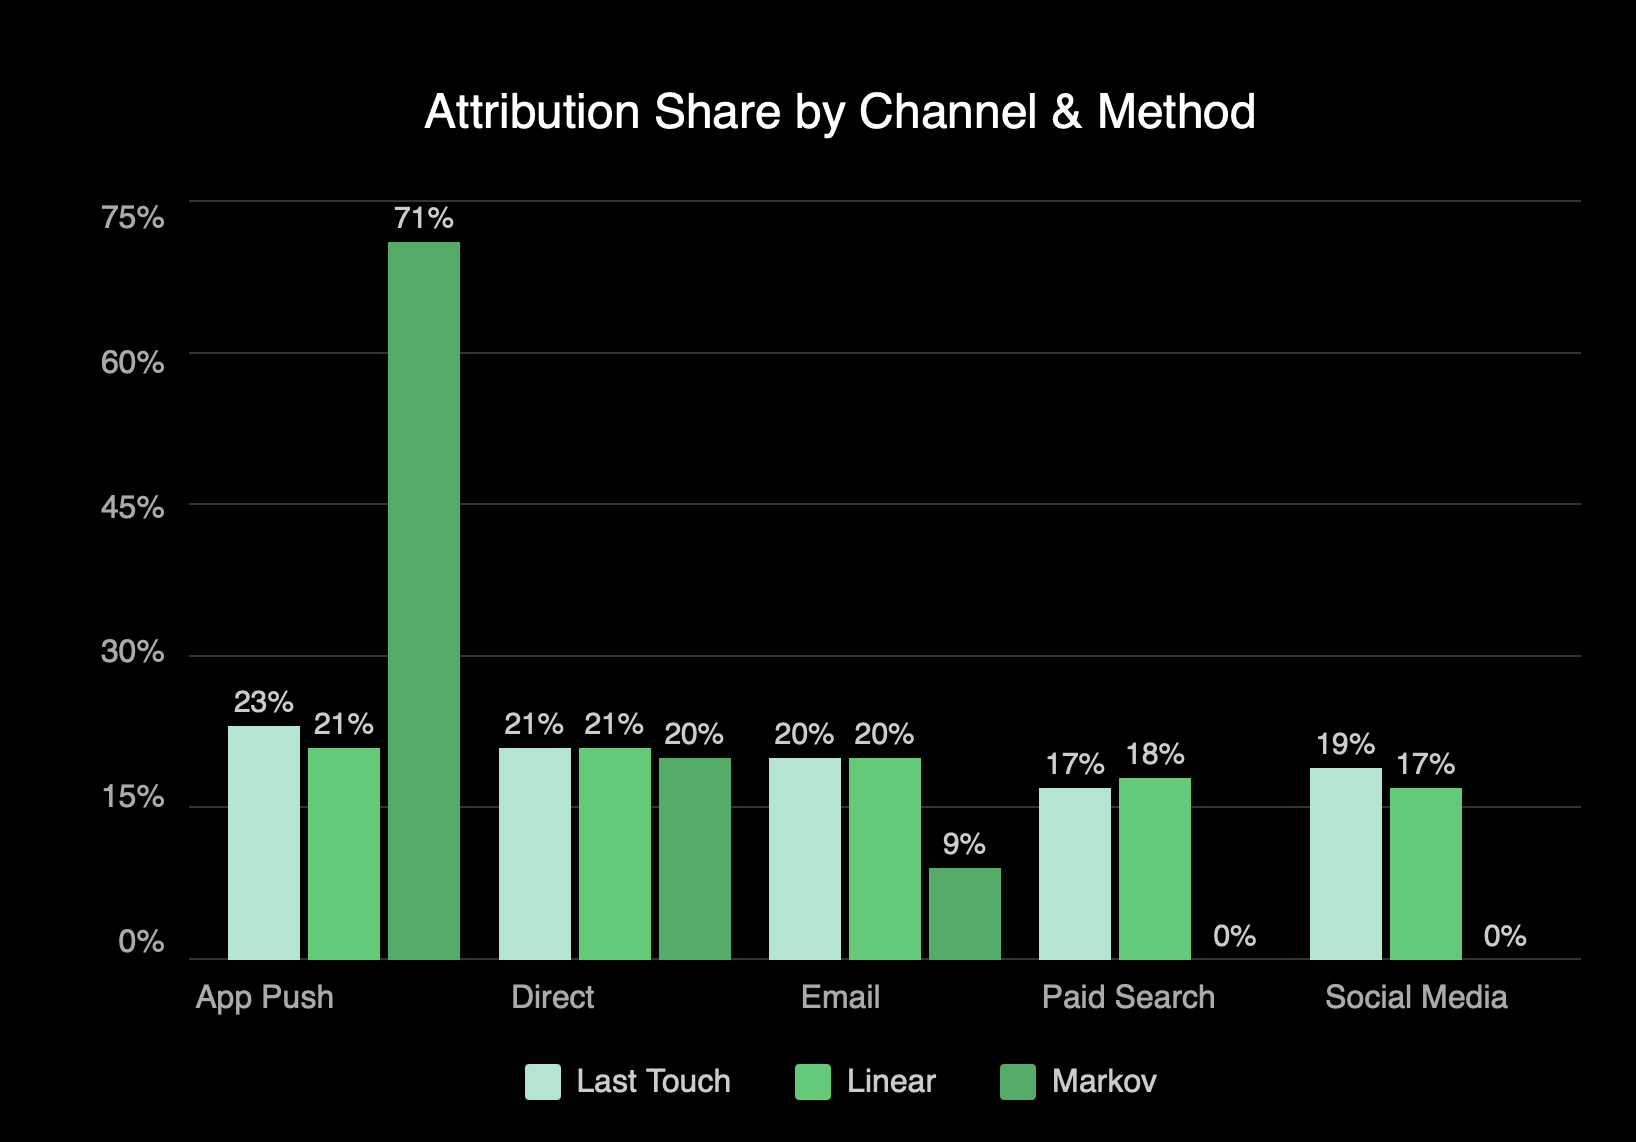
Last-touch: App Push captured the largest share (22.2%), with Direct and Paid Search close behind. Email trailed at 18.6%.
Linear: The picture flattens. Most channels fell around 20%, with App Push only slightly ahead at 20.3%.
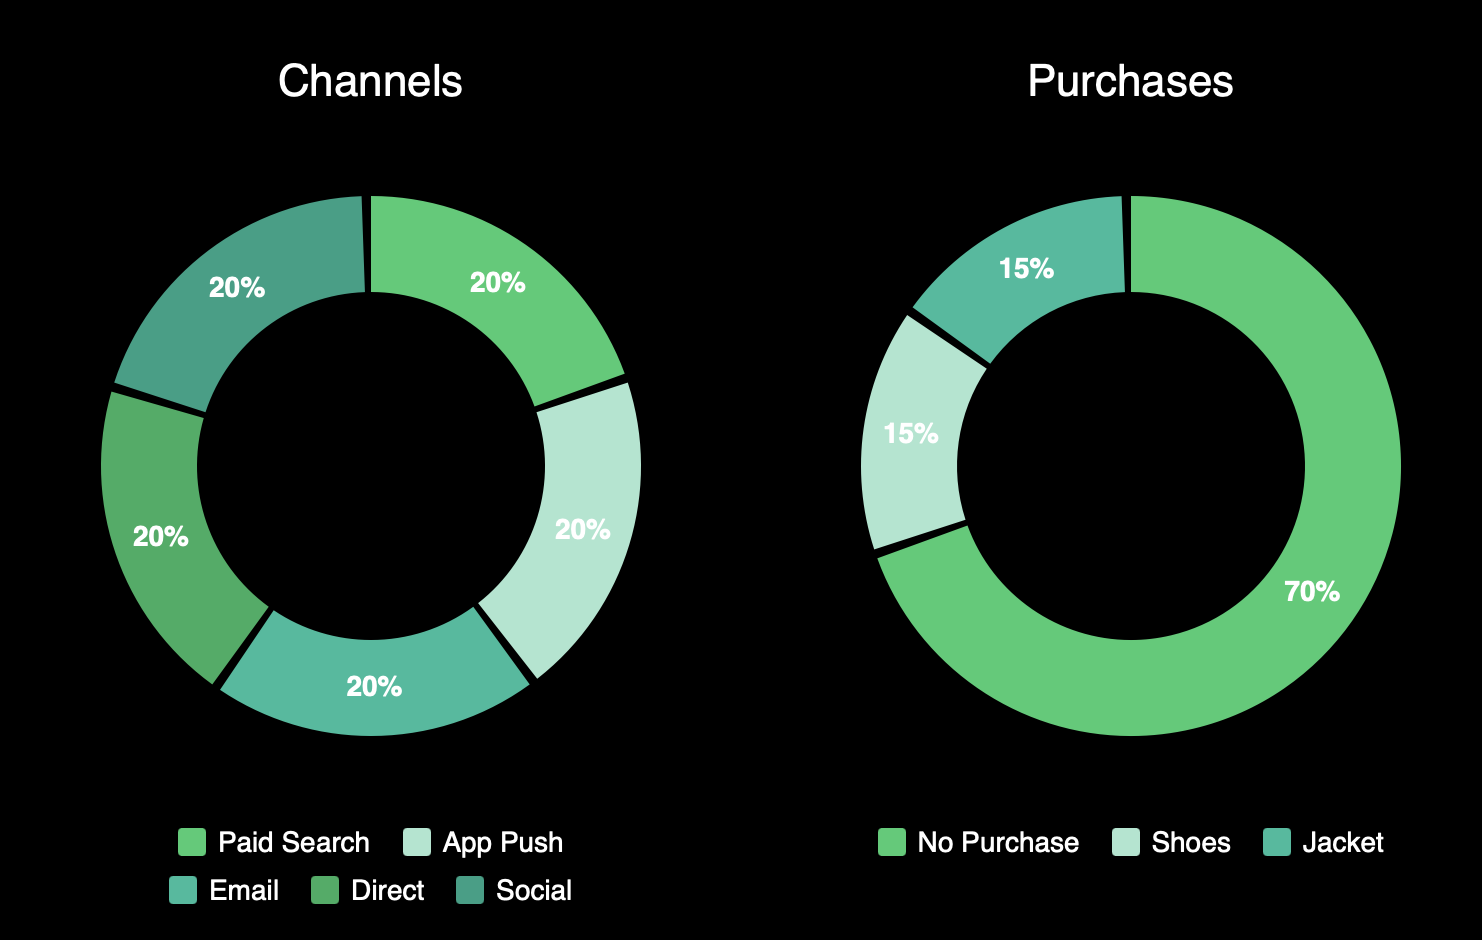
“Channels” represents the total share of touch-point interactions with that channel. “Purchases” represents the portion of touch points resulting in a sale.
The takeaway: rule-based methods blur the differences between channels, offering little guidance on where budget is truly driving performance.
Let’s see how we can improve on these results using a Markov Chain Attribution Model.
Data Driven Approach
Using a Markov model, we can see how channels contribute once we account for their incremental impact on the customer journey. By calculating the removal effect, we can measure how much the overall probability of conversion drops when a channel is removed from the customer journey.
| Marketing Channel | Last Touch Share | Linear Share |
|---|---|---|
| App Push | 22.2% | 20.3% |
| Direct | 21.0% | 20.2% |
| 18.6% | 20.0% | |
| Paid Search | 18.9% | 19.5% |
| Social Media | 19.3% | 20.0% |
The results are strikingly different:
Conversions would drop by ~75% if App Push were removed.
Direct and Paid Search still matter, but much less.
Email and Social Media showed 0% incremental lift, suggesting they added no value beyond other channels in this dataset.
While this is a randomized, synthetic dataset and not representative of true consumer behavior, it clearly demonstrates the power that Markov modeling has in revealing the true drivers of conversion, providing far stronger guidance for budget allocation.
Attribution by Product
So far, the attribution results aggregate all conversions together, across both product categories (shoes and jackets). In practice, customer journeys are rarely uniform and this aggregation can mask important differences. The channels that drive conversion in shoes may not be the same ones that drive conversion in jackets.
To capture these nuances, it’s often more useful to run attribution separately by product, allowing us to compare channel influence side by side.
Attribution for Shoe Sales vs Jacket Sales
When we look at the customer journeys by product, the channel contributions are vastly different.
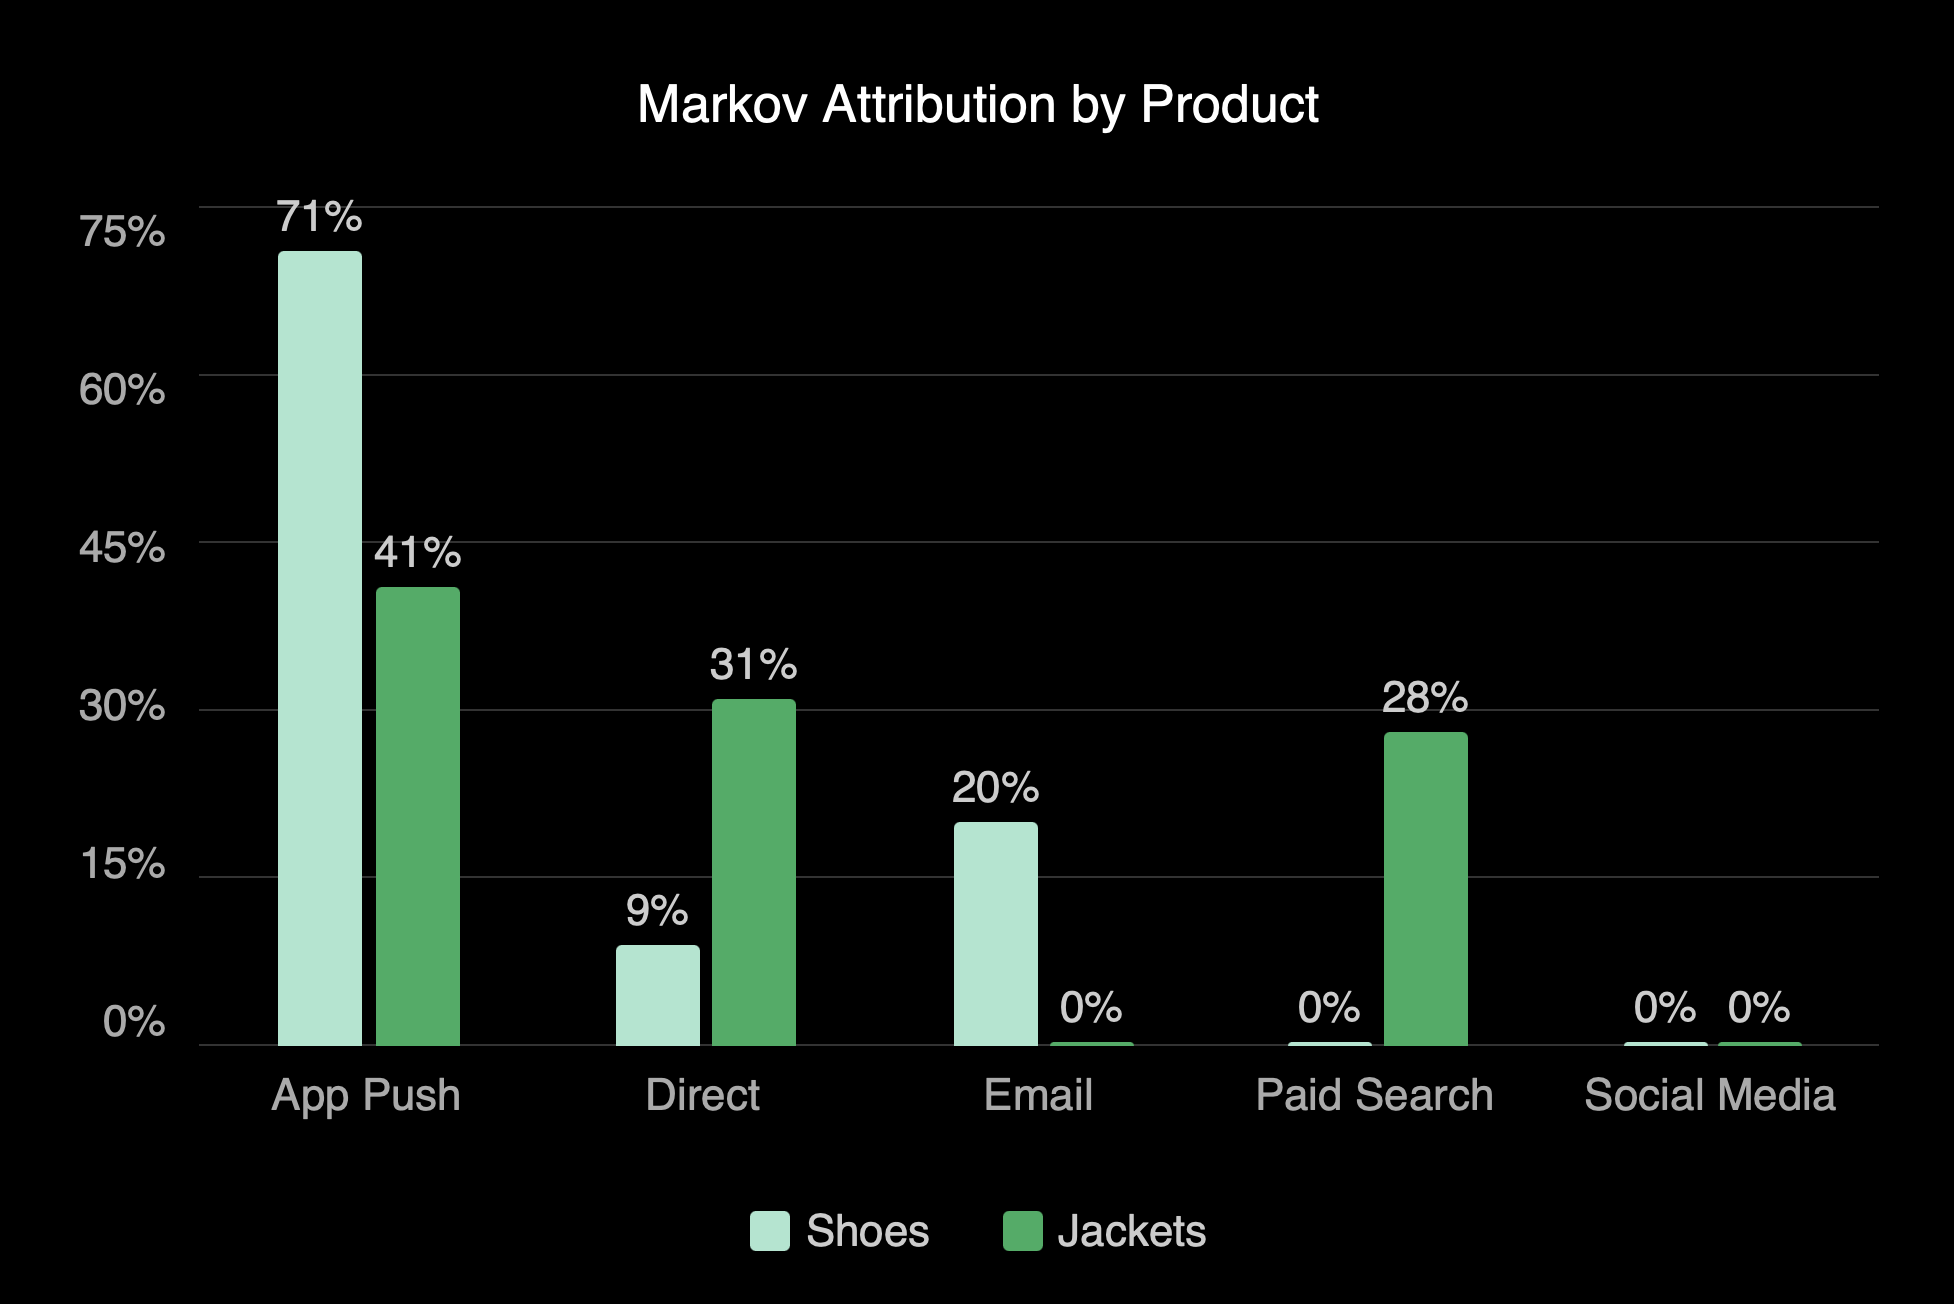
Shoes:
Largest contributor is by far app push (71%).
Paid search and social media have little impact on conversion.
Email has some impact: the model estimates a 20% drop in conversion without this channel.
In contrast, jackets:
Driven by a combination of three channels: app push (41%), direct (31%) and paid search (28%).
Email (along with social media) is estimated to have no effect on conversion.
In short, attribution at the product level exposes very different channel dynamics.
Final Takeaway
Attribution is not just about assigning credit, it’s about finding what really generates conversion. Markov modeling uses incremental impact to empower teams to allocate budgets with confidence and drive return on investment.