Project
Predicting Bank Marketing Success with Decision Trees & Random Forests
STACK: Python (pandas, NumPy, scipy, scikit-learn)
A Portuguese bank ran a phone-based marketing campaign between 2008 and 2010, aimed at selling customers a term deposit subscription. The resulting dataset captures over 45,000 of those interactions, including demographic details, previous contact history, and whether each customer eventually subscribed.
The aim was to build a classification model the marketing team could use in practice: something that would flag which customers are worth calling, so they can focus their time and reduce wasted outreach.
Starting Point: A Heavily Imbalanced Dataset
Only 11.7% of the customers in the dataset purchased a term deposit subscription. With that kind of imbalance, a model can reach 88% accuracy by predicting “no” every time, which makes accuracy a misleading metric entirely. Instead, F1 score was used throughout this project, as it accounts for both precision (how reliable positive predictions are) and recall (how many real positives the model catches). In reality, the best approach would be for the marketing team to decide ahead of time whether to prioritize precision or recall, and train the model to those specifications.
Data Cleaning and Feature Engineering
There were no null values, but a lot of “unknown” entries. The clearest example was the previous campaign outcome variable, where 99.8% of rows showed as unknown. Cross-referencing with the “days since last contact” variable showed these customers had simply never been contacted before, so unknown was relabelled as “no previous contact.” That single change increased the share of fully clean rows from 17% to 68%.
| Number of 'unknowns' per row |
Original Count (% of total rows) |
Count after relabelling (% of total rows) |
|---|---|---|
| 0 | 7,841 (17%) | 30,907 (68%, +51pp*) |
| 1 | 23,459 (52%) | 13,497 (30%, -22pp) |
| 2 | 13,119 (29%) | 753 (2%, -27pp) |
| 3 | 737 (2%) | 54 (<1%) |
*pp: percentage points
Two variables were dropped before modeling. Call duration was excluded because it is only known once the call has ended (information leak), so it cannot be used to decide who to call in the first place. The previous contacts count was removed because the same information was already captured by other campaign history variables.
Job categories were consolidated from 12 to 5 groups to reduce cardinality ahead of one-hot encoding. A quick logistic regression check confirmed the grouping barely affected predictive power (AUC 0.591 vs 0.589), so the simpler version was kept. All remaining categorical variables were one-hot encoded, and the data was split 80/20 with stratification to preserve the class ratio in both sets.
Decision Tree: Finding the Right Depth
The unpruned baseline tree overfit badly. With 6,970 leaves at depth 41, it caught only 27% of subscribers at 26% precision, giving an F1 of 0.26.
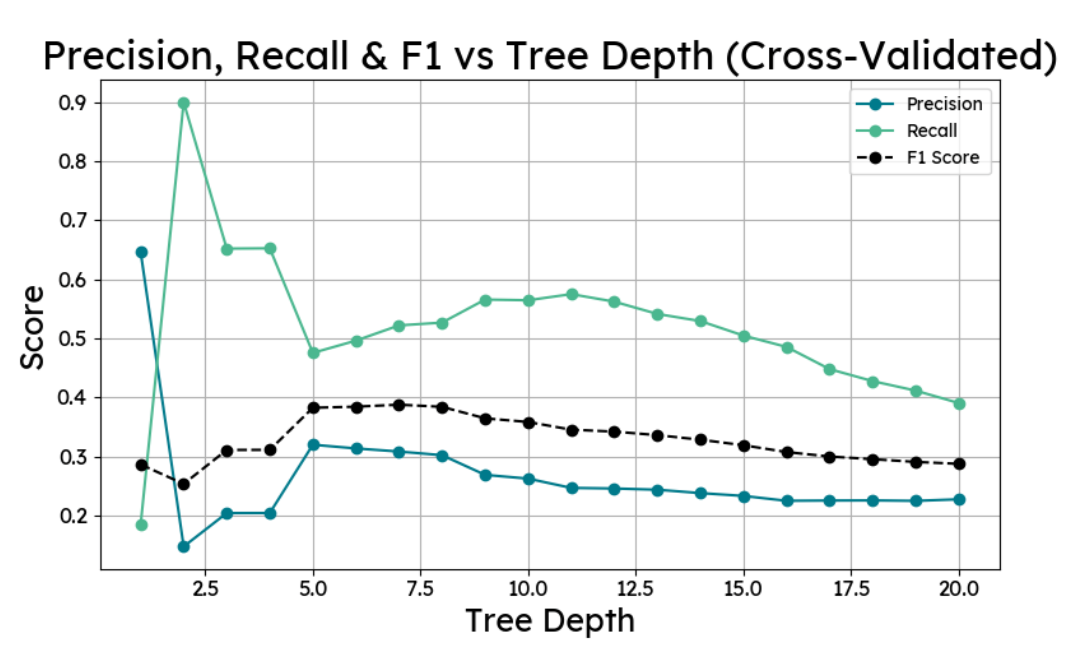
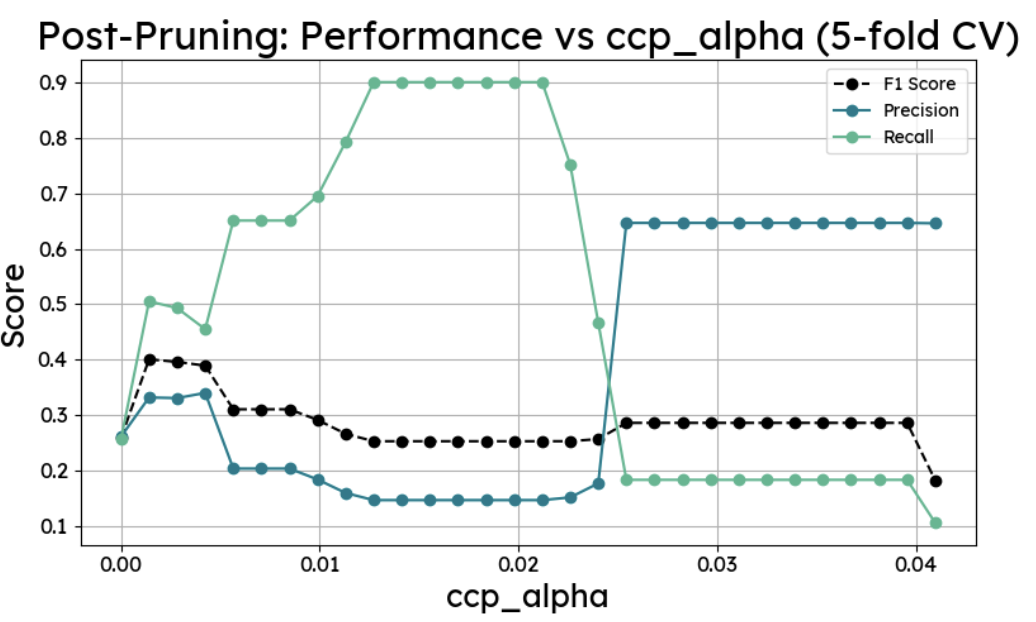
Two pruning methods were compared. The first tested every depth from 1 to 20 with 5-fold cross-validation and identified depth 7 as optimal. The second used cost-complexity post-pruning (ccp_alpha), working through 30 alpha values on a depth-20 tree to find the point of best generalisation, which landed at alpha 0.0014 and depth 8. Both approaches produced nearly the same result: F1 of 0.40, recall of around 0.52. The max-depth-8 method was simpler, so that was used.
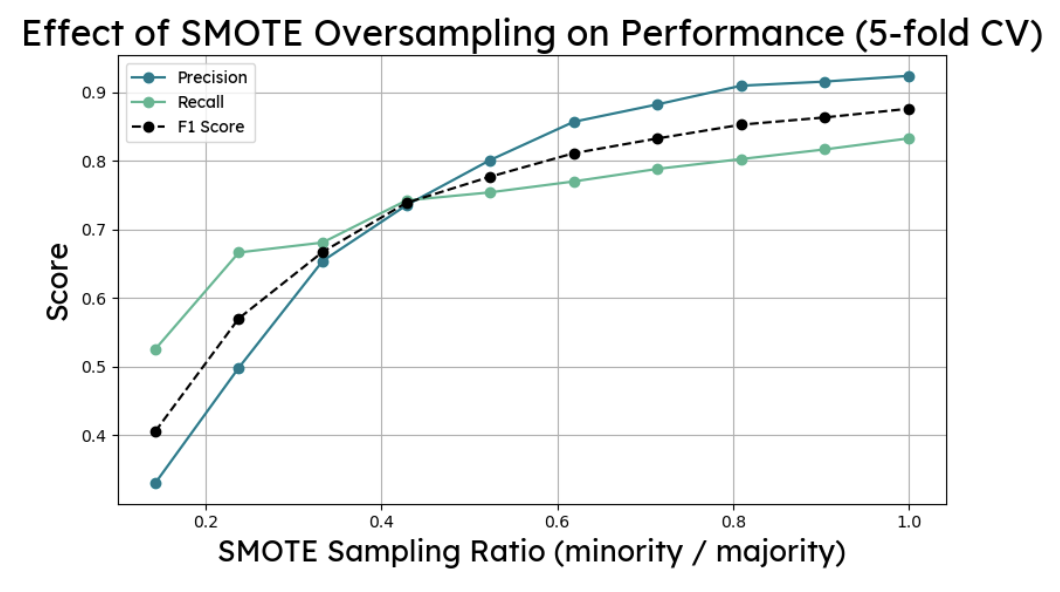
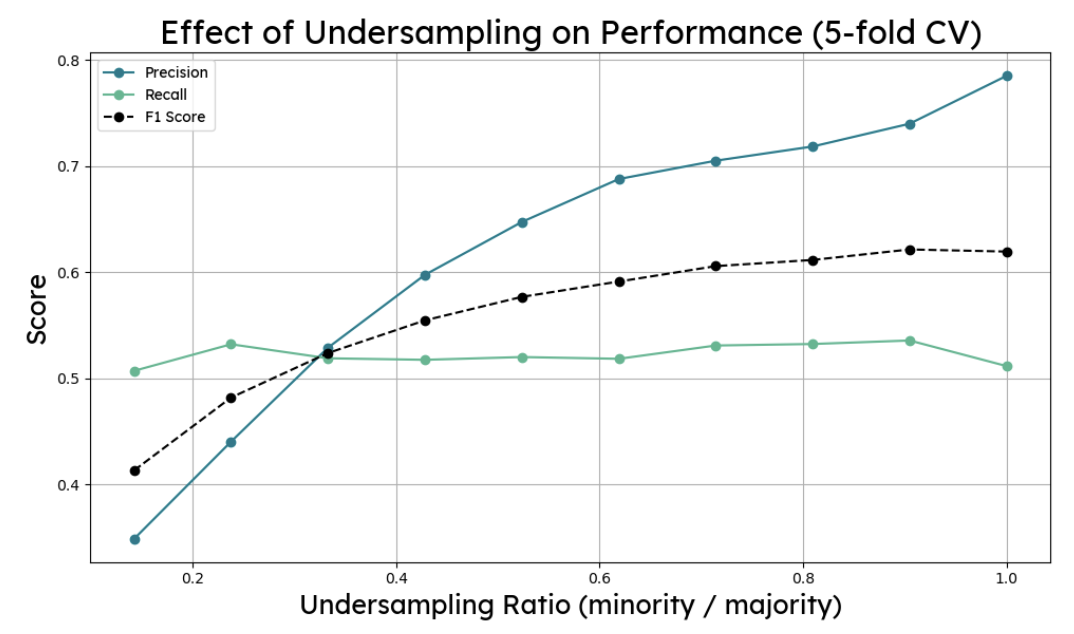
SMOTE oversampling and random undersampling were both tested on the pruned tree. Neither improved the F1 score on the test set. The resampling ratios were tuned on training data and did not transfer cleanly, which is a good reminder that cross-validation performance and held-out test performance can diverge. No resampling was applied to the final tree, which used max depth 8 with a threshold of 0.51, landing at F1: 0.40, precision: 0.33, recall: 0.52.
Random Forest: More Stable, Better Recall
A 200-tree random forest with max depth 12 improved on the decision tree from the start, matching its precision while pushing recall up to 0.58 (F1: 0.42). Averaging predictions across many trees reduces the variance that a single tree is prone to, and the difference in recall is a direct reflection of that.
The same resampling experiments were run again. Undersampling at a ratio of 1 pushed recall to 0.65 but dropped precision to 0.28 and accuracy to 0.76 (F1: 0.39). SMOTE at ratio 1 went the other way, raising precision to 0.47 while recall fell to 0.33 (F1: 0.39). The benchmark forest without resampling remained the better option on F1. Threshold tuning to 0.58 gave the best final result.
Final Model Performance
The final random forest used 200 trees, max depth 12, and a probability threshold of 0.58:
Precision: 0.39
Recall: 0.48
F1 Score: 0.43
Accuracy: 85%
In practical terms: of all the customers the model flags as likely subscribers, 39% actually are. And it successfully identifies 48% of all real subscribers in the dataset. Given the class imbalance, getting meaningful precision and recall simultaneously is genuinely difficult, and both figures represent a significant improvement on the unpruned baseline.
Strongest predictor variables
The decision tree placed the most importance on whether a customer had subscribed during a previous campaign (importance score: 0.34), followed by unknown contact method and the quarter of contact. The random forest spread importance more evenly across housing loan status, previous campaign contact history, and contact method.
Prior campaign success being the strongest signal makes sense for a repeat-contact product. The prominence of ‘contact method unknown’ in both models suggests there may be a customer segment worth investigating separately.
How the model improves marketing roi
The random forest can be used to score new customers before a campaign runs, ranking them by predicted subscription probability. The marketing team can then set a threshold based on their priorities: a higher threshold means fewer, more confident calls; a lower threshold means broader coverage with more potential subscribers reached.
The model as built optimises for F1, which balances the two. If the team’s main constraint is call capacity, they would want to raise the threshold and prioritise precision. If they want to minimise missed opportunities, lowering it to maximise recall makes more sense.
To improve future versions, collecting richer customer data would help. Salary banding, number of existing products, and household information are all likely to add predictive signal that the current dataset does not capture.